 |

AES means Auger Electron Spectroscopy. For the record, we'll mention that Auger phenomenon characterises a de-excitation process leading to the loss of one electron. This electron is known as an Auger electron.
Auger spectroscopy allows determining the chemical composition of a surface. This characterisation can be achieved up to 1 nm depth. The smallest surface that can be characterised is a few nm wide for the best instruments.  AES analysis basics. AES analysis basics.
An electron gun is used as an excitation source. It can be a standard or a field effect source. Field effect sources show better brightness and resolution performance.
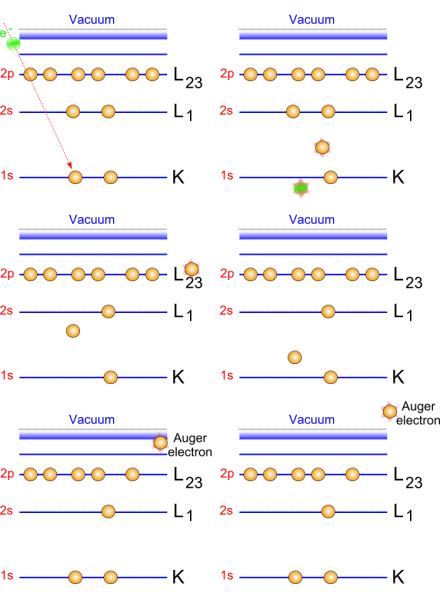
Emitted electrons penetrate the matter and undergo collisions with other electrons. When these electrons belong to the core level, their ejection is followed by transitions: excitations/ de-exitations. Auger electrons are generated by these transitions.   Auger emission principle Auger emission principle
A green incident electron emitted by the gun is colliding with a 1s-shell electron. Ejecting this electron generates a loss of energy that will be compensated by an electron transition from 2s-shell toward 1s shell. This generates a radiation which causes an Auger electron to be ejected.
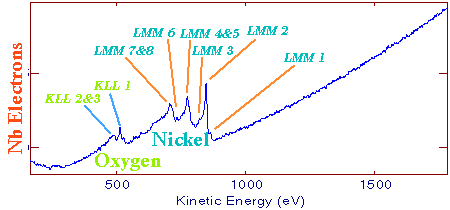
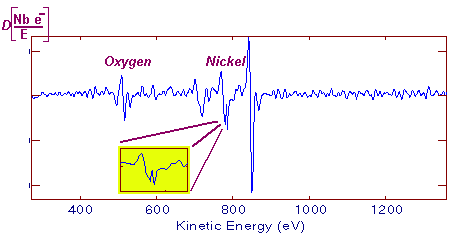
Each emitted Auger electron is resulting from well-defined and identified transitions. In the case above, we talk about KLL transition because of the shells involved in the different transition mechanisms. To be complete, we must also say that ejecting an electron does not lead to the final state: this phenomenon goes on until the atom recovers a balanced energy state. For a given element, several lines and Auger emissions can be observed. Let's take for example nickel contained in a nickel oxide specimen. This spectrum is generally obtained with a 1 eV acquisition step and it shows the main lines for this element.  Typical nickel oxide Auger spectrum. By using the first order derivative of the signal it is possible to get a better line assignment. The derivative signal highlights inflexion points (slope sign changes in the original signal). It becomes then easier to distinguish between LMM4 and LMM5 transitions. This area has been coloured in green on the following spectrum.  First order derivative spectra |