 |
  The quantification The quantification
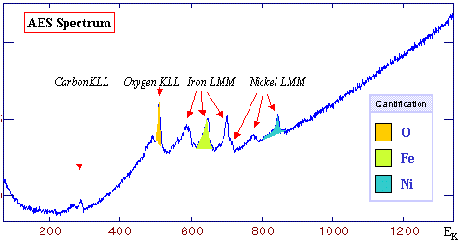
After the identification, the quantification is the second step of an AES analysis. This quantification is achieved by using the spectrum peak areas. You may choose to use either the peak area initially calculated, or the intensity of its first derivative. Now, we shall deal with the first example.
Considering the identified peaks, we choose among the most intense lines which are well separated from each other. The spectrum below contains four elements: Carbon, oxygen, iron and nickel. Each one of these elements shows several transitions. The coloured areas represent our choice. For this quantification, we ignore the carbon content.
 We cannot directly use the areas for the calculations, it is indeed necessary to consider various electron/matter interaction phenomena. It is necessary to include matrix effects and interaction cross sections in these calculations. Usually these corrections are integrated in a single factor available in the decomposition program. The sensitivity factor given in the 'Periodic Table' page of this site is directly usable to carry out these corrections on the spectra that you obtain from the Thermo Electron spectrometers. For other spectrometers, either use the decomposition program which must integrate these sensitivity factors or contact your retailer. In practice, the aboveshown wide scan is not sufficient, it is necessary to further acquire within each area, using a better resolution. To conclude, it is thus enough to divide the area by its sensitivity factor to obtain a corrected area usable to calculate either a 100% chemical composition, or atomic ratios.  AES is more sensitive than XPS. AES is more sensitive than XPS.
AES is a technique often described as more sensitive than XPS. It is partially true. In fact the difference in sensitivity is primarily due to the differences in electron kinetic energies. For example in the case of carbon, in XPS the kinetic energy is close to 1000 eV as opposed to 250 eV in AES. Because the mean free path changes with the electron kinetic energy (see IMFP grapher), the depth of analysis will be smaller in AES than in XPS in the case of a carbon containing specimen. As a matter-of-fact, the surface contamination (primarily carbon and oxygen) is a much more sensitive factor in AES. An ion etching is sometimes necessary to study surfaces with this spectroscopy.
 AES complement of the XPS. AES complement of the XPS.
AES is the ideal complement of XPS. Known as XAES, this technique consists in simultaneously studying the Auger transitions from a photoelectron and the XPS lines. The Auger spectroscopy is not very sensitive to chemical environment, thus allowing here to solve indeterminations on the chemical state of certain elements. It is the case for aluminium the XPS lines of which exit with the same energy: only the Auger lines (obtained from a Mg source) solve the chemical nature of the element.
|