 |
  The mean free path The mean free path
This subject was and remains a study subject for many programmes. Work completed up to now propose various solutions, some of them are presented in the following pages. It will be up to the reader to supplement this brief presentation by consulting, for example, the bibliographical references located at the end of this section.
 Reaching the surface. Reaching the surface.
When an X-ray source or an electron gun strikes a surface, we mainly observe an electron emission. These electrons, extracted from atoms, before reaching surface, travel on a certain distance accross matter. This distance depends on several parameters, two of them are of great influence: The initial electron energy and the nature of the medium interacting with this electron.
In XPS and AES, the electron kinetic energy, characterizes the chemical state of the atom. It becomes interesting to know the distance which an electron can traverse while keeping its kinetic energy. The distance covered by an electron between two inelastic shocks is called "mean free path". This distance is noted: λ Warning: it represents a distribution average. Electrons can traverse a larger or smaller distance. When the electron undergoes a shock, its energy changes randomly and it contributes to the background noise build up. The electrons which leave the matter without inelastic shock form the peaks. The following example illustrates this idea. An excited atom emits four electrons shown by small red balls. Two of these electrons, will undergo interaction of an inelastic type. In such cases these interactions lead to a loss of kinetic energy. They are further shown by green balls and contribute to build-up the background noise. In brief, in an XPS or AES spectrum, the background noise results from electrons which underwent an inelastic shock and the peaks result from electrons having reached the surface without any inelastic interaction.
 From which depth do these electrons come from? From which depth do these electrons come from?
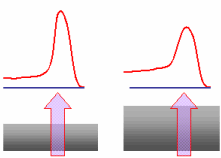
These inelastic shocks and thus the background noise of the spectrum have been found to be related to the layer thickness of the matter crossed by the electron. The following drawing illustrates this phenomenon.
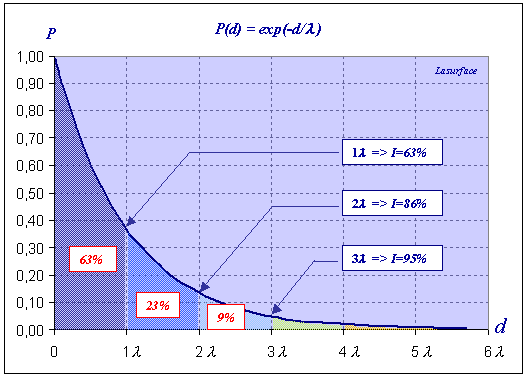
 While crossing the matter, the electrons are submitted to absorption laws. It is possible for a given depth of emission d to calculate the probability that the emitted electron reaches the surface. The following graph shows the evolution of this probability as a function of the depth d  Bear in mind that λ is the average travel distance of an electron in a given material. To know the percentage of electrons coming from a depth ranging between 0 and λ, it is sufficient to calculate the integral (the dark blue area under the curve) of the function P between 0 and λ  How to model their trajectories? How to model their trajectories?
The equations of absorption are not sufficient to model with a good precision the electron travel distances in the matter.
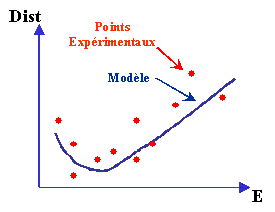
Many experiments were conducted in order to determine with precision the distance covered by the electrons as a function of matter nature and their kinetic energy. From these data, a function passing through as many points as possible was calculated. According to the material types and the degree of accuracy, there are various models.  Example of an IMFP modeling. The Best fits give results with less than 10% uncertainty. At energies below 100 eV, the models become less precise. Models as TPP-2M give a better precision than those used in IMFP Grapher but, for the moment, their complexity does not allow to implement them with a java applet This work gave rise to many publications and today research is still going on. To describe the research progress on this subject, it should be recalled that in 2000 took place an International Workshop entitled IMFP2000. Two publications, recognised as reference work, were used for the program calculating the IMFP: IMFP Grapher. |