 |

Here are UPS spectra examples:
 Example #1 Example #1
It shows a spectrum that has been obtained by UV photoelectron spectroscopy with a specimen having an alternating graphite/donor salt structure.
It was acquired in kinetic energy using the 21.2 eV line of He I.
On this spectrum, there are several regions of interest.
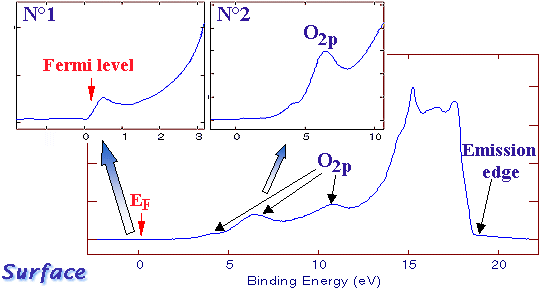
This second example also concerns a graphite-alternated structure. The compound is slightly oxidized and O2p contributions or visible. The binding energy display of the spectrum is useful to see other aspects of the above-explained phenomena.  Example #2 Example #2
#1 zoom shows the Fermi level. Electrons having this energy level are weakly bound to the atom nucleus. A small energy increase is sufficient to free them from its attraction. They are then available for freely moving in the material or crossing its surface and travel in the vacuum.
#2 zoom shows a partial view of O2p contributions.  Graphite specimen spectrum According to what we have seen the first example the UV source can at excite electrons at levels higher than its own energy. The spectrum ends around 18 eV rather than 21 eV, this can be explained in the following way: The difference is due to the fact that a "work function" energy must be overcome to eject the electron from the matter into the vacuum where it can be collected by the electron analyser. If the electron kinetic energy is below this work energy, the electron will not be released in the vacuum and will not appear on the spectrum. |
|||||||||||||